Most teams don’t plan to run blind in production. It just happens.
What changed, and what’s failing right now?
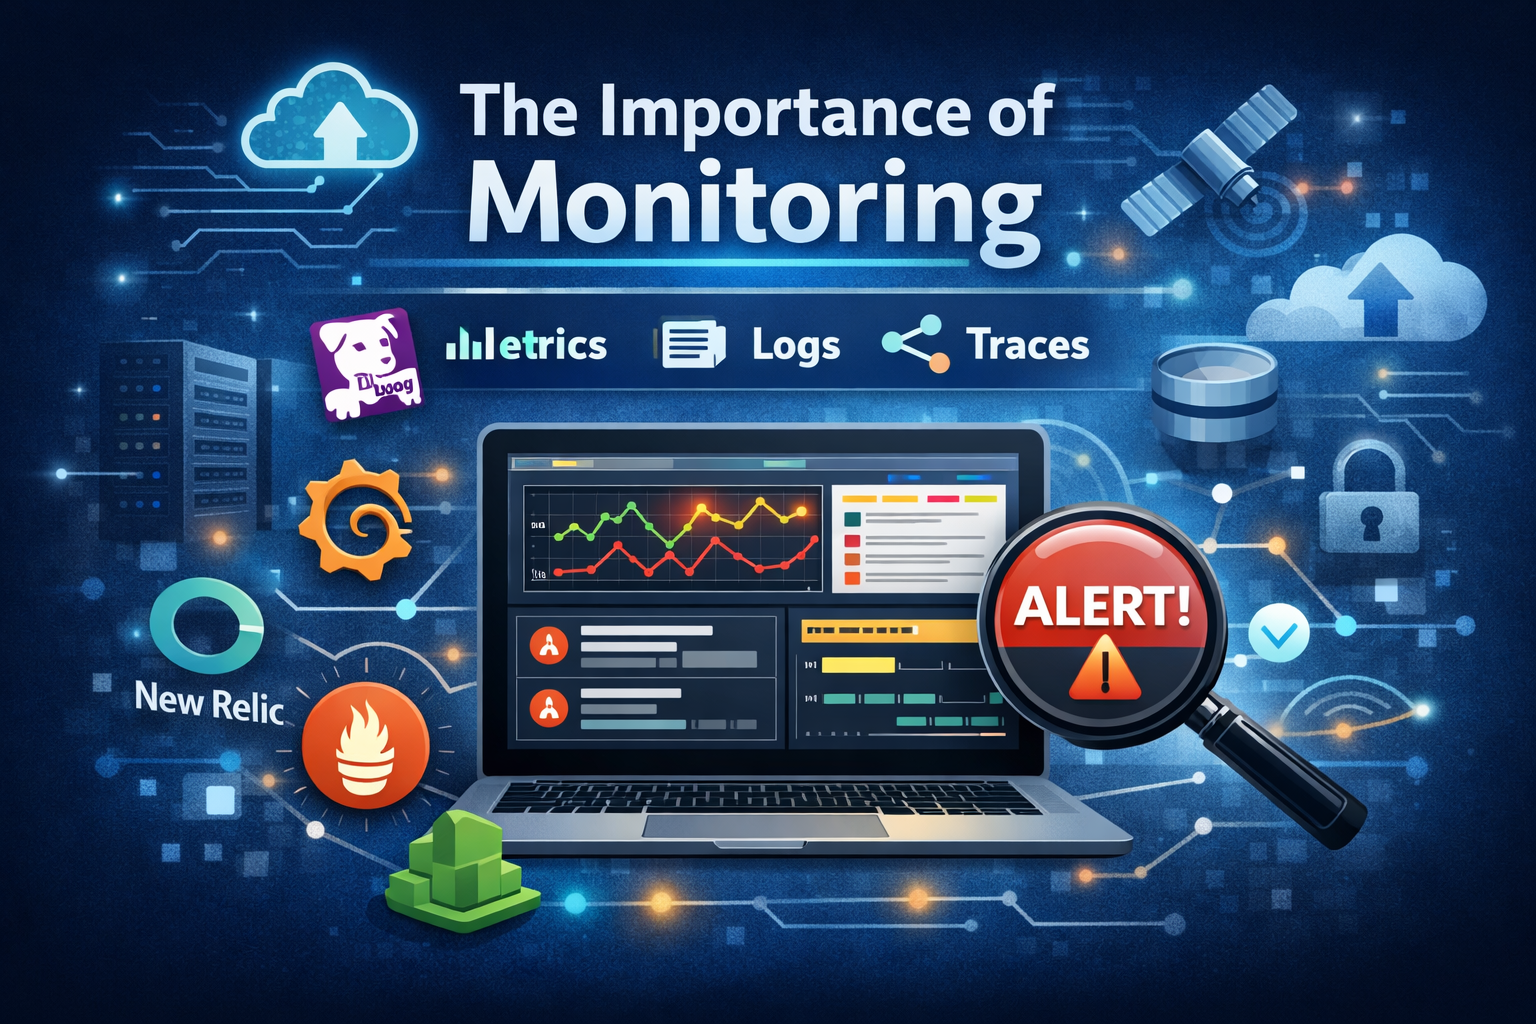
Monitoring turns production from guesswork into a system you can reason about. It helps you detect issues early, understand impact, and fix problems with confidence—without slowing delivery.
You ship fast, add features, grow traffic, integrate more services… and suddenly a “small” incident becomes a 2-hour fire drill because nobody can answer the first question:
What monitoring really gives you (beyond dashboards)
Monitoring isn’t “nice charts.” It’s your operational feedback loop.
- Early detection: catch failures before users do.
- Faster debugging: reduce time-to-root-cause with real signals.
- Impact awareness: know who is affected and how much.
- Release confidence: ship more often because you can see what’s happening.
- Cost control: find noisy services, inefficient queries, and infrastructure waste.
If you’re aiming for predictable delivery, monitoring is the safety net that lets you move fast without breaking trust.
The three pillars: metrics, logs, and traces
A solid observability setup usually includes these three signals:
1) Metrics
Great for understanding system health at a glance.
- Latency (p95/p99), throughput, error rates
- CPU/memory, saturation, queue depth
- SLOs like “99.9% of requests under 300ms”
2) Logs
Great for context and detailed events.
- Application errors and stack traces
- Security/audit logs
- Business events (payments, signups, critical workflows)
3) Traces (distributed tracing)
Great for modern systems with multiple services.
- “Where is this request spending time?”
- “Which dependency is causing the slowdown?”
- “Why do only some users experience this issue?”
Most incident headaches come from missing one of these signals.
The monitoring stack: what tools are available today
There’s no single “best” tool—there’s the right fit for your team, architecture, and maturity. Here are common choices teams use today:
All-in-one observability platforms
These platforms usually cover metrics + logs + traces (and more) in one place:
- Datadog
- New Relic
- Dynatrace
- Elastic Observability (Elastic Stack)
Best when you want fast time-to-value, less operational overhead, and a unified experience.
Open-source and modular stacks
Great if you want flexibility or need to run parts yourself:
- Grafana (dashboards + alerting ecosystem)
- Prometheus (metrics)
- Loki (logs, works well with Grafana)
- Tempo / Jaeger (tracing)
- OpenTelemetry (instrumentation standard for traces/metrics/logs)
Best when you want control, customization, and cost optimization at scale (with some extra setup work).
Cloud-provider native monitoring
Convenient and often “good enough” for early stages:
- AWS CloudWatch
- Google Cloud Operations (formerly Stackdriver)
- Azure Monitor
Best when you want minimal setup and tight integration with your cloud environment.
Error tracking and product-focused visibility
Sometimes the fastest win is capturing exceptions and user impact:
- Sentry
- Rollbar
Best when you want immediate clarity on application errors and release regressions.
What “good monitoring” looks like in practice
A monitoring setup is effective when:
- You have alerts tied to user impact (not just CPU spikes).
- You track golden signals (latency, traffic, errors, saturation).
- You can connect the dots between a release and a metric change.
- You have at least one dashboard that answers:
“Is the system healthy right now?” - You can debug an incident using metrics → logs → traces, in that order.
Monitoring shouldn’t be a wall of noise. It should be a clear, actionable view of system reality.
Where most teams go wrong
A few patterns we see often:
- Alert fatigue: too many alerts, no ownership, no tuning.
- Dashboards without decisions: graphs that don’t drive action.
- No instrumentation strategy: metrics and logs exist, but don’t answer questions.
- No SLOs/SLIs: teams can’t define “good” vs “bad” service health.
Fixing these usually has less to do with buying a tool and more to do with designing a monitoring approach around how your team operates.
Monitoring is part of delivery, not a separate project
Monitoring becomes truly valuable when it ships with the product:
- New endpoint? Add key metrics and error tracking.
- New service? Add service-level dashboards and SLOs.
- New release? Add annotation + track regressions.
This is how you keep shipping without losing reliability.